Linear Regression CalculatorPerform linear regression to find the best-fit line equation with prediction capability.

Linear Regression Calculator
Perform linear regression to find the best-fit line equation with prediction capability.
Enter X and Y Data
Input your data points as comma or space separated values.
Optional: Predict
Enter an X value to predict the corresponding Y.
View Results
See regression equation, slope, intercept, R², and predictions.
What Is Linear Regression Calculator?
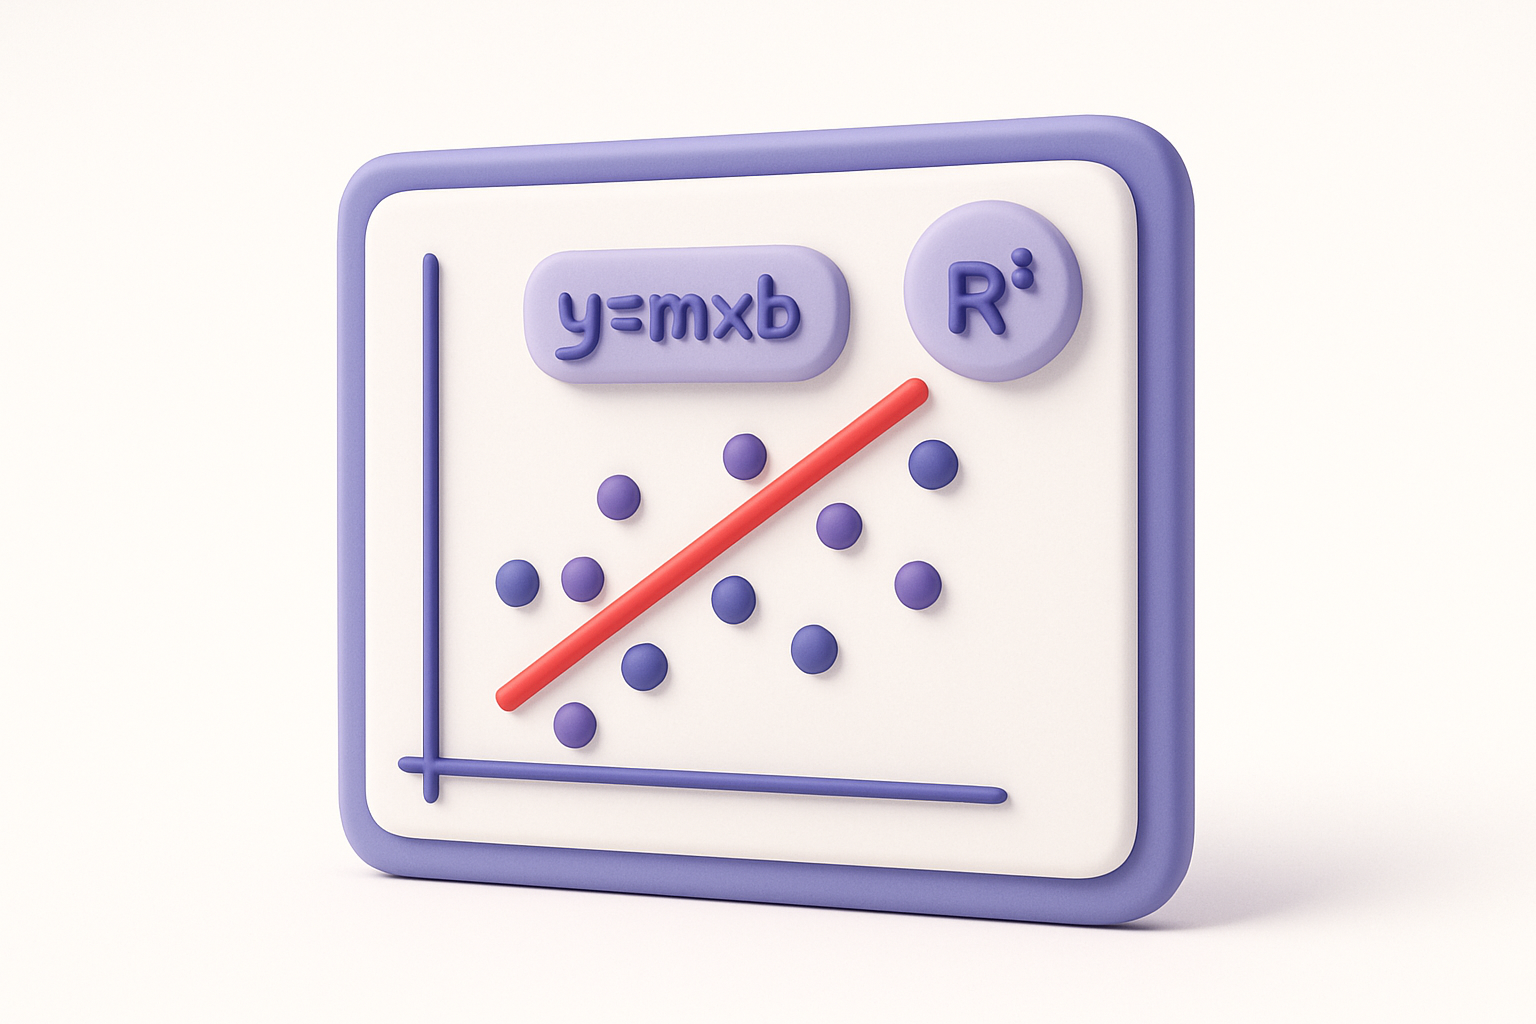
The Linear Regression Calculator finds the best-fit straight line through a set of data points using the least squares method. It computes the regression equation (y = b₁x + b₀), where b₁ is the slope and b₀ is the y-intercept. The calculator also provides the correlation coefficient (r), R-squared value, standard error, and optionally predicts Y values for new X inputs. Linear regression is one of the most fundamental tools in statistics and data science, used to model relationships between variables and make predictions.
Why Use Our Linear Regression Calculator?
- Computes complete regression equation with slope and intercept
- Shows R-squared, correlation, and standard error
- Built-in prediction for new X values
- Displays the least squares formula for educational reference
Common Use Cases
Trend Analysis
Identify trends in time series data (sales, temperature, etc.).
Forecasting
Predict future values based on historical data trends.
Scientific Research
Model linear relationships between experimental variables.
Business Planning
Project revenue, costs, or growth based on historical data.
Technical Guide
The least squares regression computes: b₁ (slope) = Σ(xᵢ−x̄)(yᵢ−ȳ) / Σ(xᵢ−x̄)², and b₀ (intercept) = ȳ − b₁x̄. The standard error of the estimate: SE = √(Σ(yᵢ−ŷᵢ)² / (n−2)), where ŷᵢ = b₁xᵢ + b₀ are the predicted values. R² = r² measures goodness of fit. Predictions: for a new x, ŷ = b₁x + b₀. Assumptions of linear regression: linearity, independence, normality of residuals, and homoscedasticity (constant variance). The model minimizes the sum of squared vertical distances from each point to the line.
Tips & Best Practices
- 1Always visualize your data before fitting a line — the relationship should be approximately linear
- 2R² near 1 indicates a good fit; near 0 indicates the linear model explains little variance
- 3Be cautious extrapolating far beyond the range of your data
- 4Check for outliers — a single extreme point can heavily influence the regression line
Related Tools


Correlation Calculator
Calculate Pearson and Spearman correlation coefficients with R-squared interpretation.
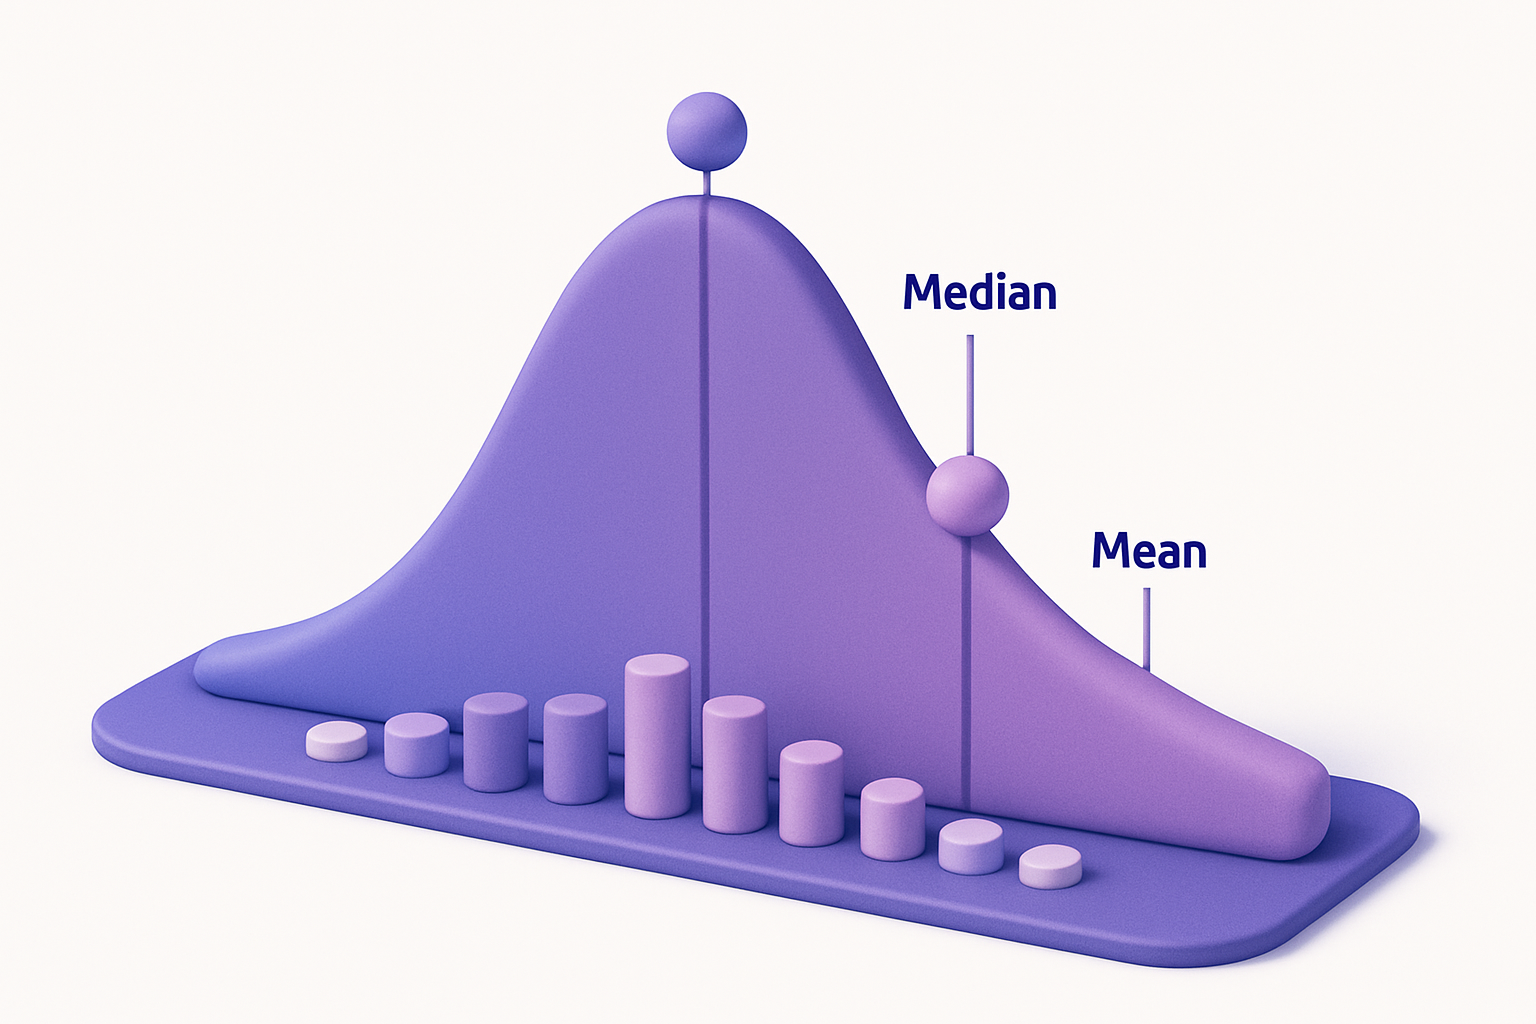

Mean, Median & Mode Calculator
Calculate mean, median, mode, range, and other central tendency measures for any dataset.


Confidence Interval Calculator
Calculate confidence intervals from summary statistics or raw data with multiple confidence levels.


Percentage Calculator
Calculate percentages, percentage change, and what percent one number is of another.


Fraction Calculator
Add, subtract, multiply, and divide fractions with automatic simplification.


Scientific Calculator
Full-featured scientific calculator with trigonometry, logarithms, factorials, and more.
Frequently Asked Questions
QWhat does the slope mean?
QWhat is the y-intercept?
QHow reliable are predictions?
QWhat is the standard error?
QHow many data points do I need?
About Linear Regression Calculator
Linear Regression Calculator is a free online tool from FreeToolkit.ai. All processing happens directly in your browser — your data never leaves your device. No registration required. No ads. Just fast, reliable tools.