Correlation CalculatorCalculate Pearson and Spearman correlation coefficients with R-squared interpretation.

Correlation Calculator
Calculate Pearson and Spearman correlation coefficients with R-squared interpretation.
Enter X Values
Input your X dataset as comma or space separated numbers.
Enter Y Values
Input your Y dataset (same number of values as X).
View Correlation
See Pearson r, Spearman ρ, R-squared, and interpretation.
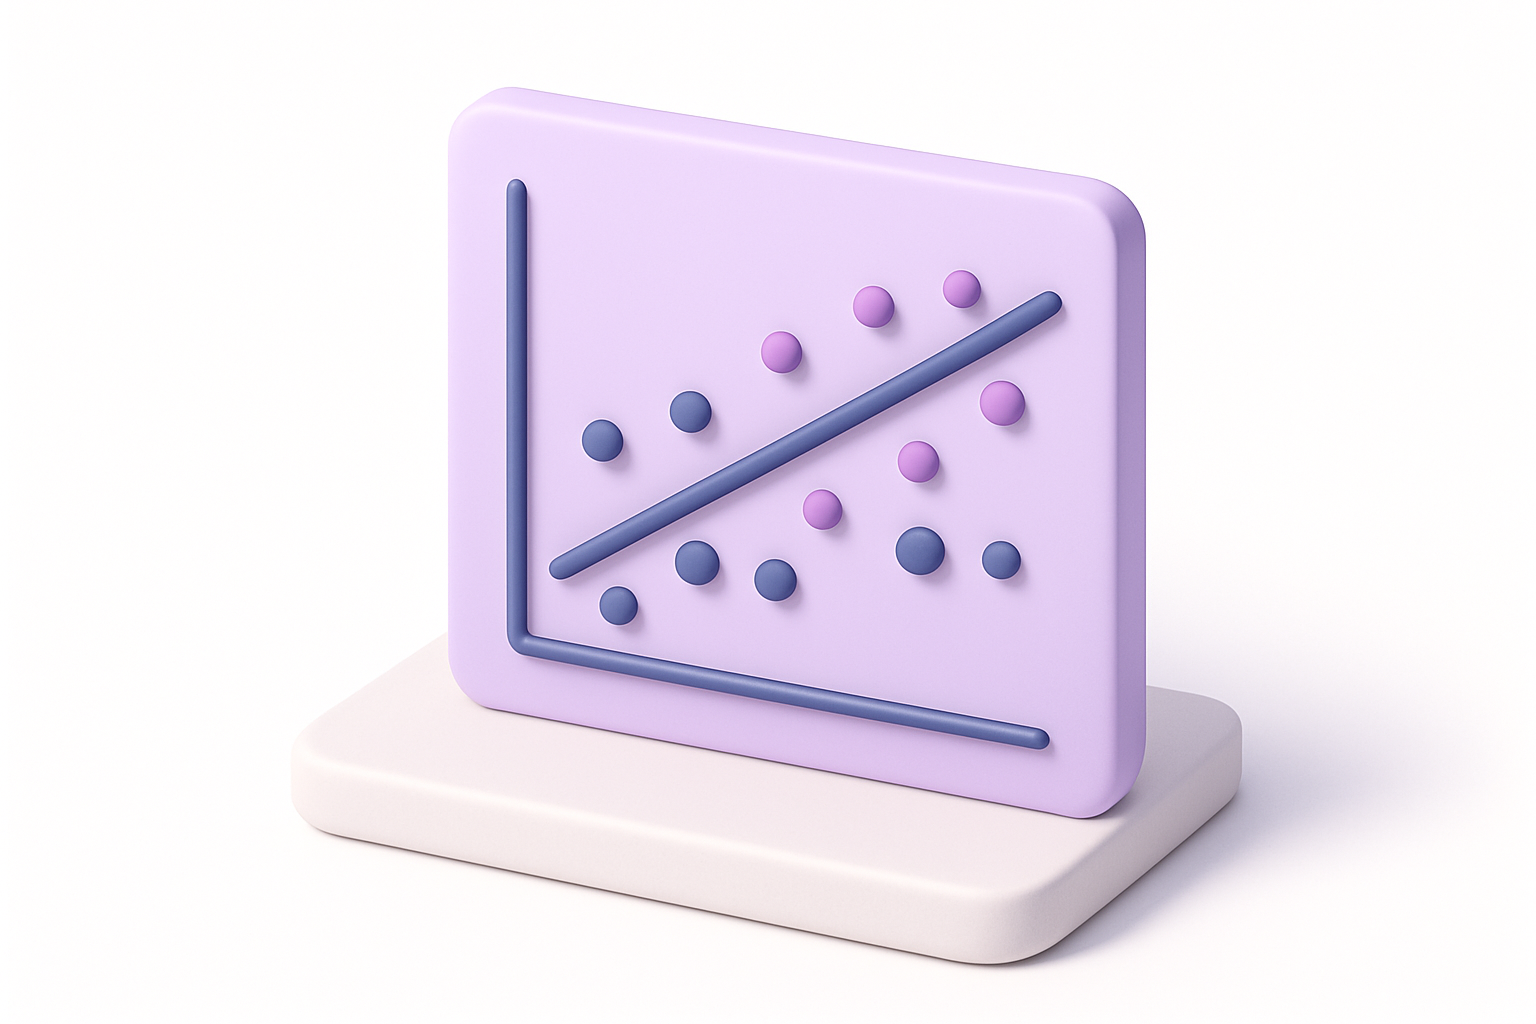
What Is Correlation Calculator?
The Correlation Calculator computes both Pearson and Spearman correlation coefficients to measure the strength and direction of the relationship between two variables. Pearson's r measures linear correlation (how well data fits a straight line), while Spearman's ρ measures monotonic correlation (whether variables tend to move in the same direction). R-squared (R²) indicates the proportion of variance in one variable explained by the other. The calculator classifies the correlation strength (weak, moderate, strong) and direction (positive, negative), providing a clear interpretation of the relationship.
Why Use Our Correlation Calculator?
- Computes both Pearson (linear) and Spearman (rank) correlations
- Shows R-squared for explained variance interpretation
- Classifies correlation strength and direction
- Displays means and data point count
Common Use Cases
Research Analysis
Measure relationships between variables in scientific studies.
Business Intelligence
Identify correlations between business metrics (sales vs advertising).
Education
Explore relationships in data for statistics coursework.
Quality Control
Test relationships between process variables and outcomes.
Technical Guide
Pearson correlation: r = Σ(xᵢ−x̄)(yᵢ−ȳ) / √(Σ(xᵢ−x̄)² × Σ(yᵢ−ȳ)²). Values range from -1 (perfect negative) to +1 (perfect positive), with 0 indicating no linear correlation. Spearman rank correlation: ρ = 1 − 6Σdᵢ² / (n(n²−1)), where dᵢ is the rank difference. R-squared = r² represents the proportion of variance in Y explained by X. Strength interpretation: |r| < 0.3 = weak, 0.3-0.7 = moderate, > 0.7 = strong. Important: correlation does not imply causation — two variables can be correlated without one causing the other.
Tips & Best Practices
- 1Correlation does not imply causation — always consider confounding variables
- 2Pearson is sensitive to outliers; Spearman is more robust
- 3Both variables must have the same number of data points
- 4Use Spearman for ordinal data or non-linear monotonic relationships
Related Tools
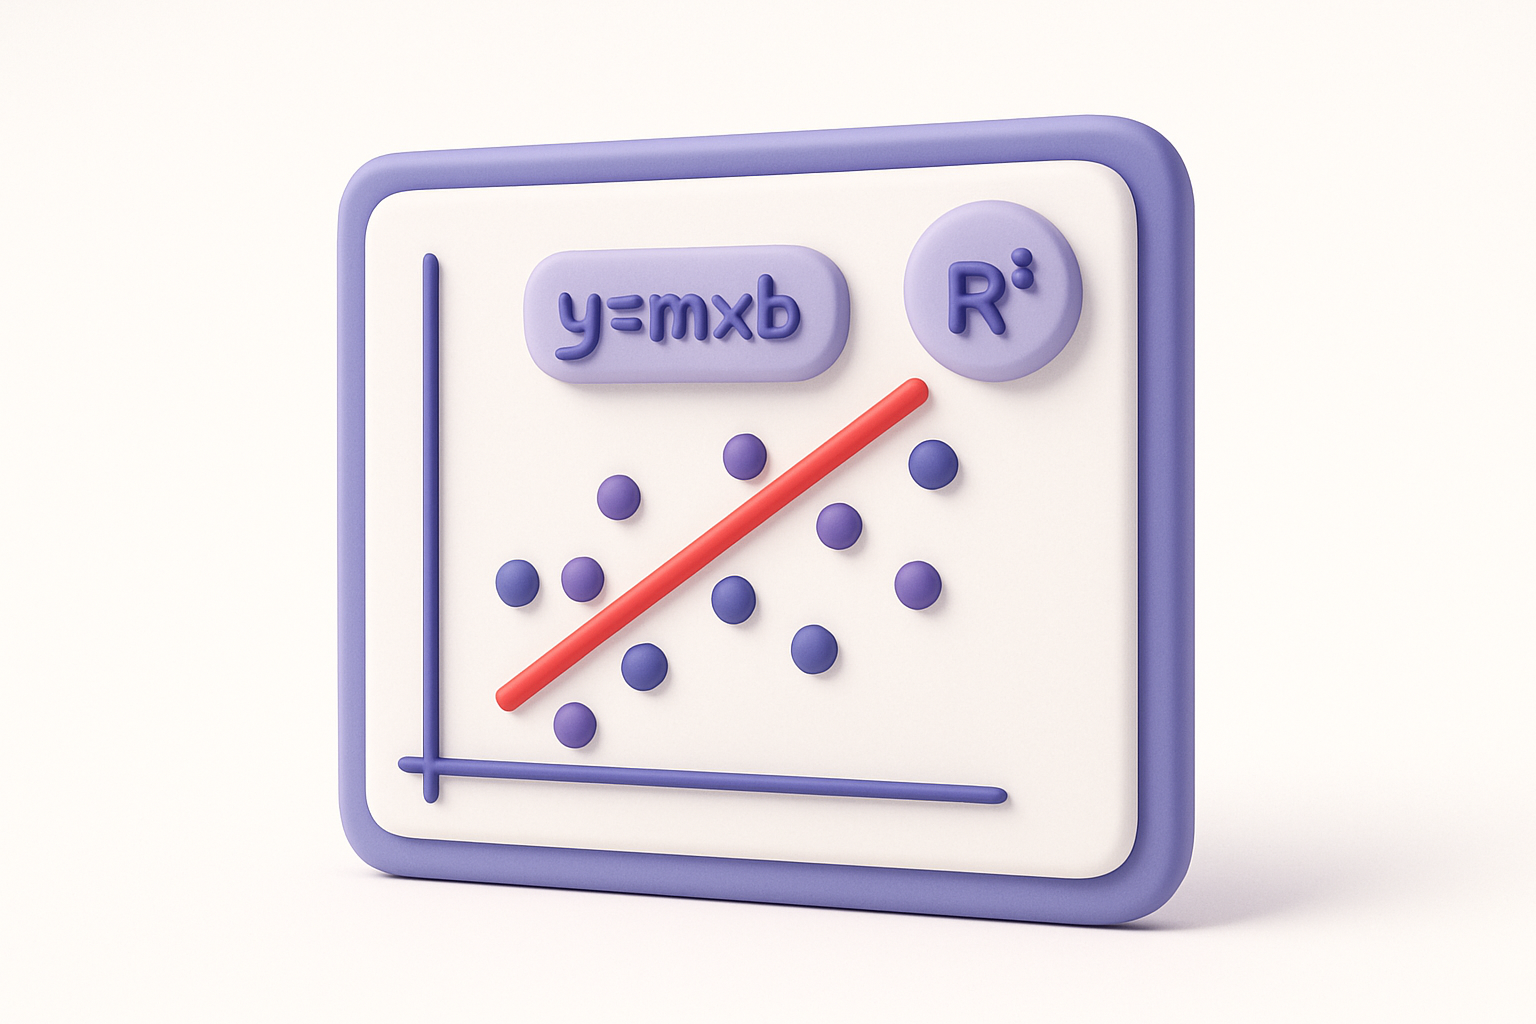

Linear Regression Calculator
Perform linear regression to find the best-fit line equation with prediction capability.
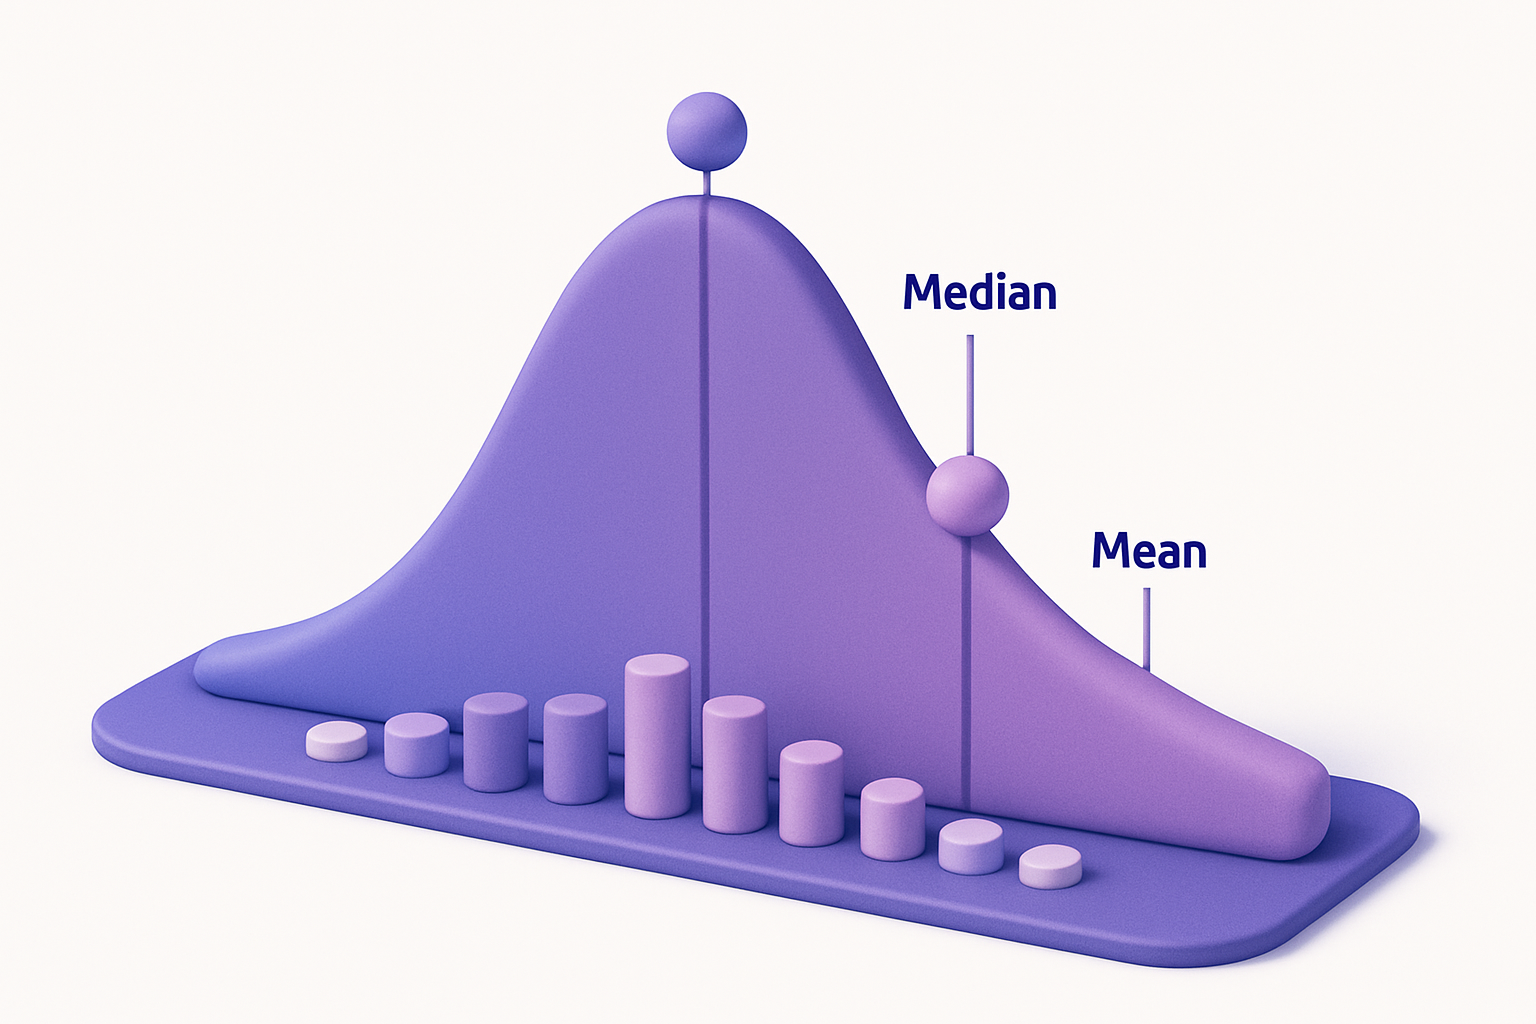
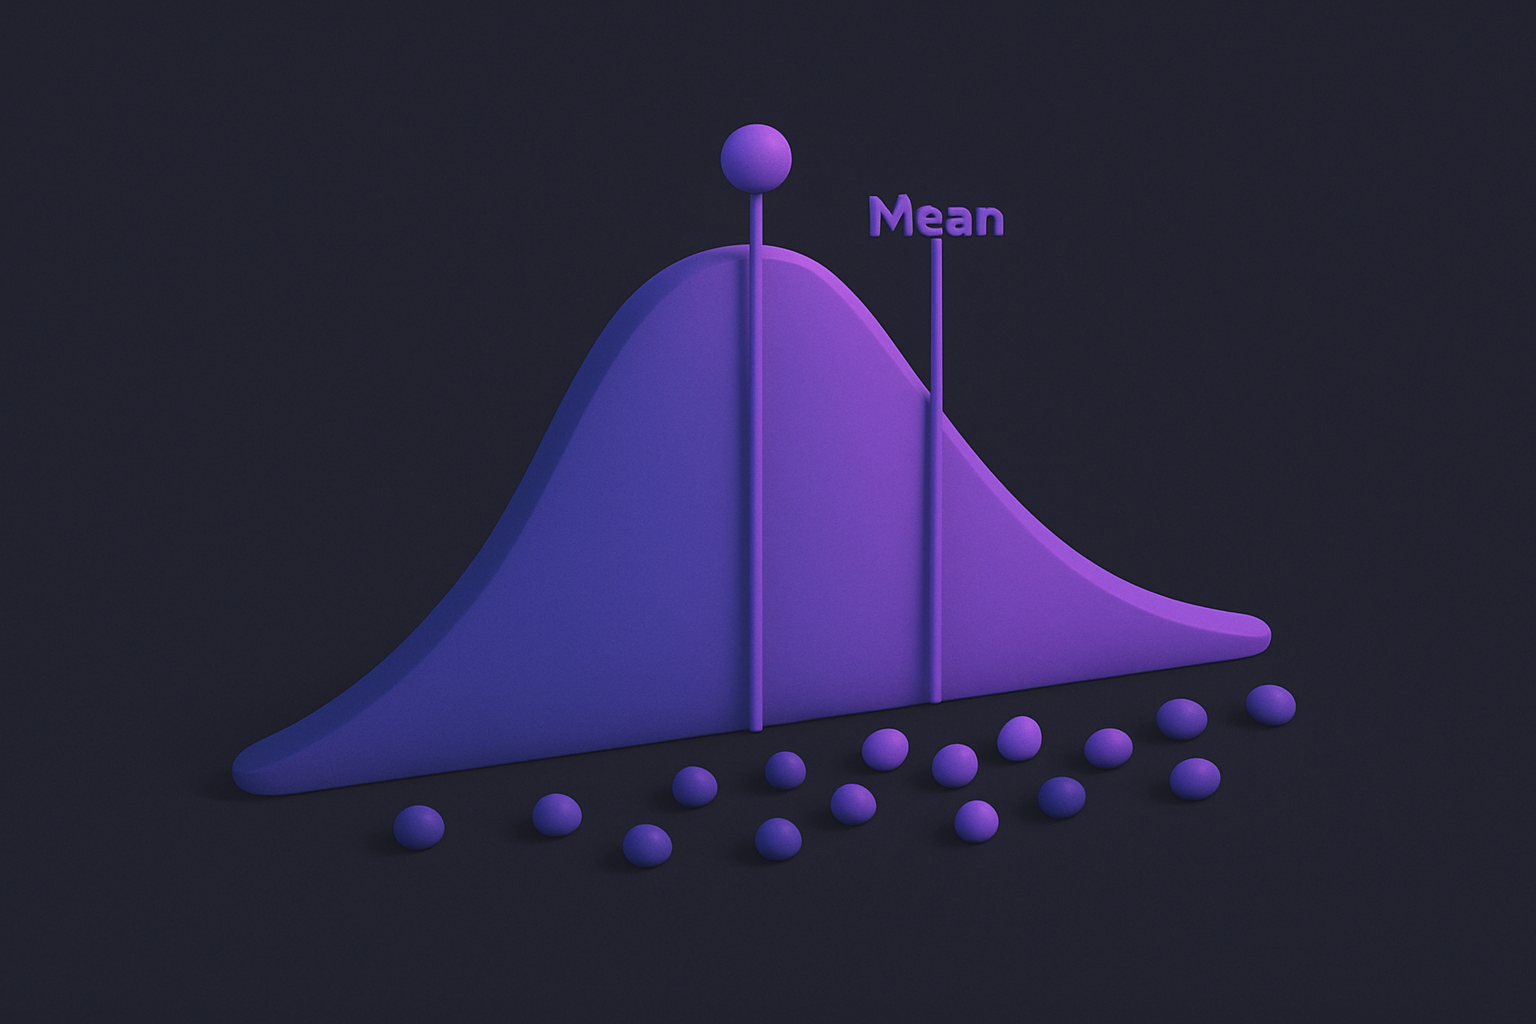
Mean, Median & Mode Calculator
Calculate mean, median, mode, range, and other central tendency measures for any dataset.

Confidence Interval Calculator
Calculate confidence intervals from summary statistics or raw data with multiple confidence levels.

Percentage Calculator
Calculate percentages, percentage change, and what percent one number is of another.


Fraction Calculator
Add, subtract, multiply, and divide fractions with automatic simplification.


Scientific Calculator
Full-featured scientific calculator with trigonometry, logarithms, factorials, and more.
Frequently Asked Questions
QWhat is a good correlation?
QWhat is the difference between Pearson and Spearman?
QCan correlation be negative?
QWhat does R-squared mean?
QHow many data points do I need?
About Correlation Calculator
Correlation Calculator is a free online tool from FreeToolkit.ai. All processing happens directly in your browser — your data never leaves your device. No registration required. No ads. Just fast, reliable tools.