Image HistogramVisualize the color distribution of an image with RGB and luminance histograms.
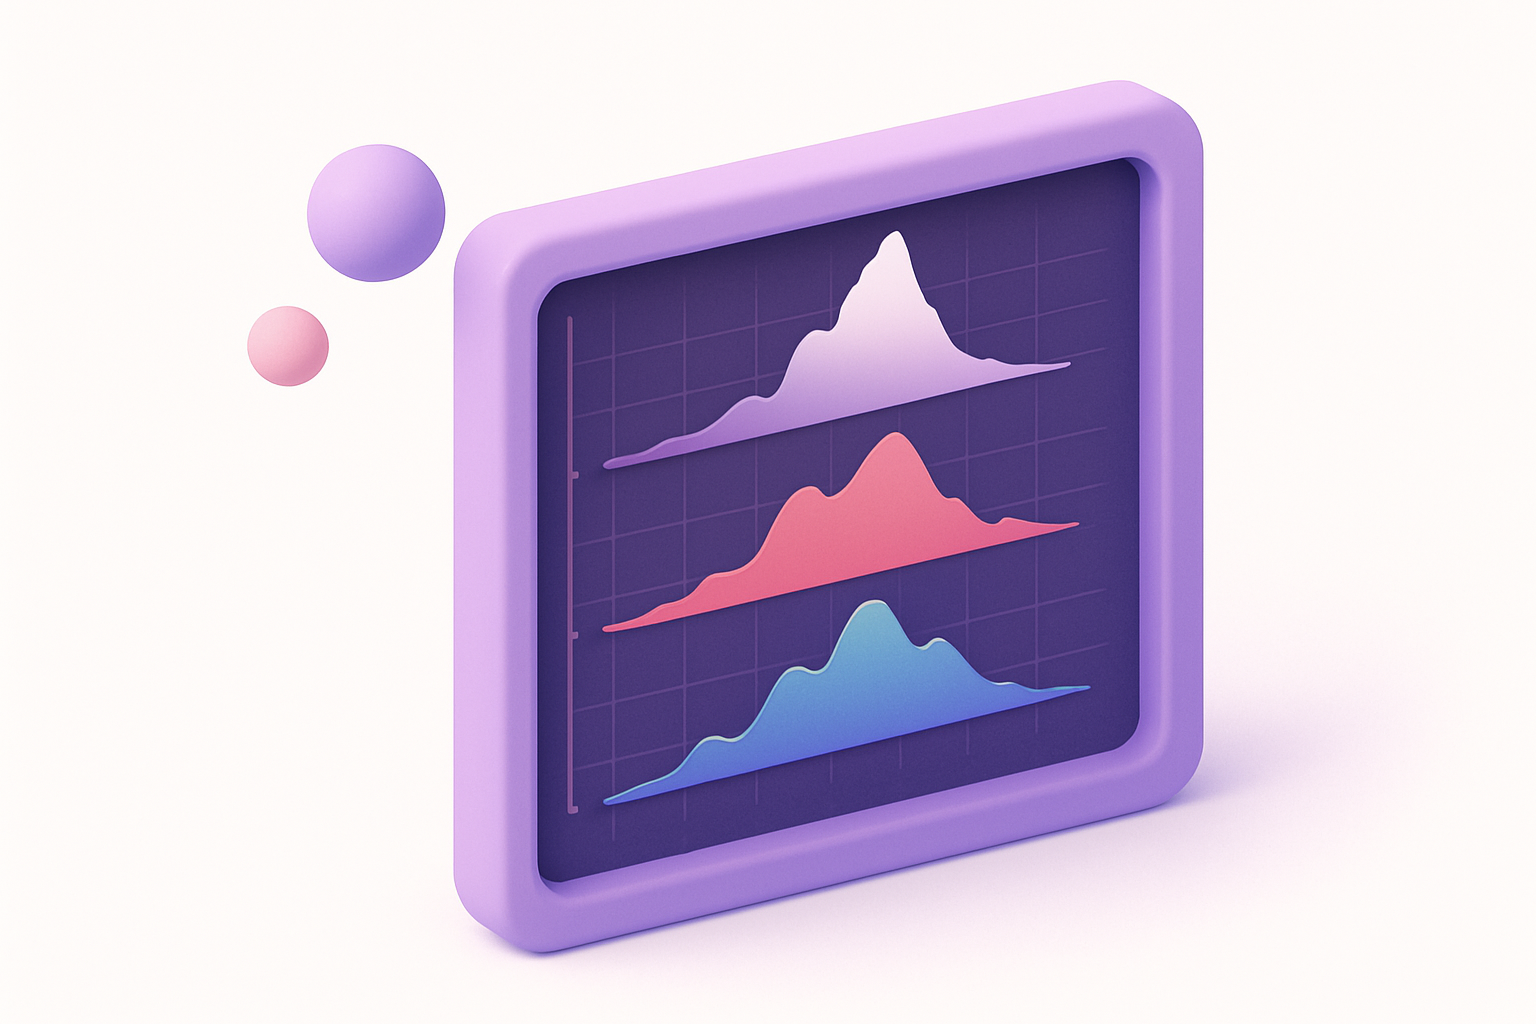
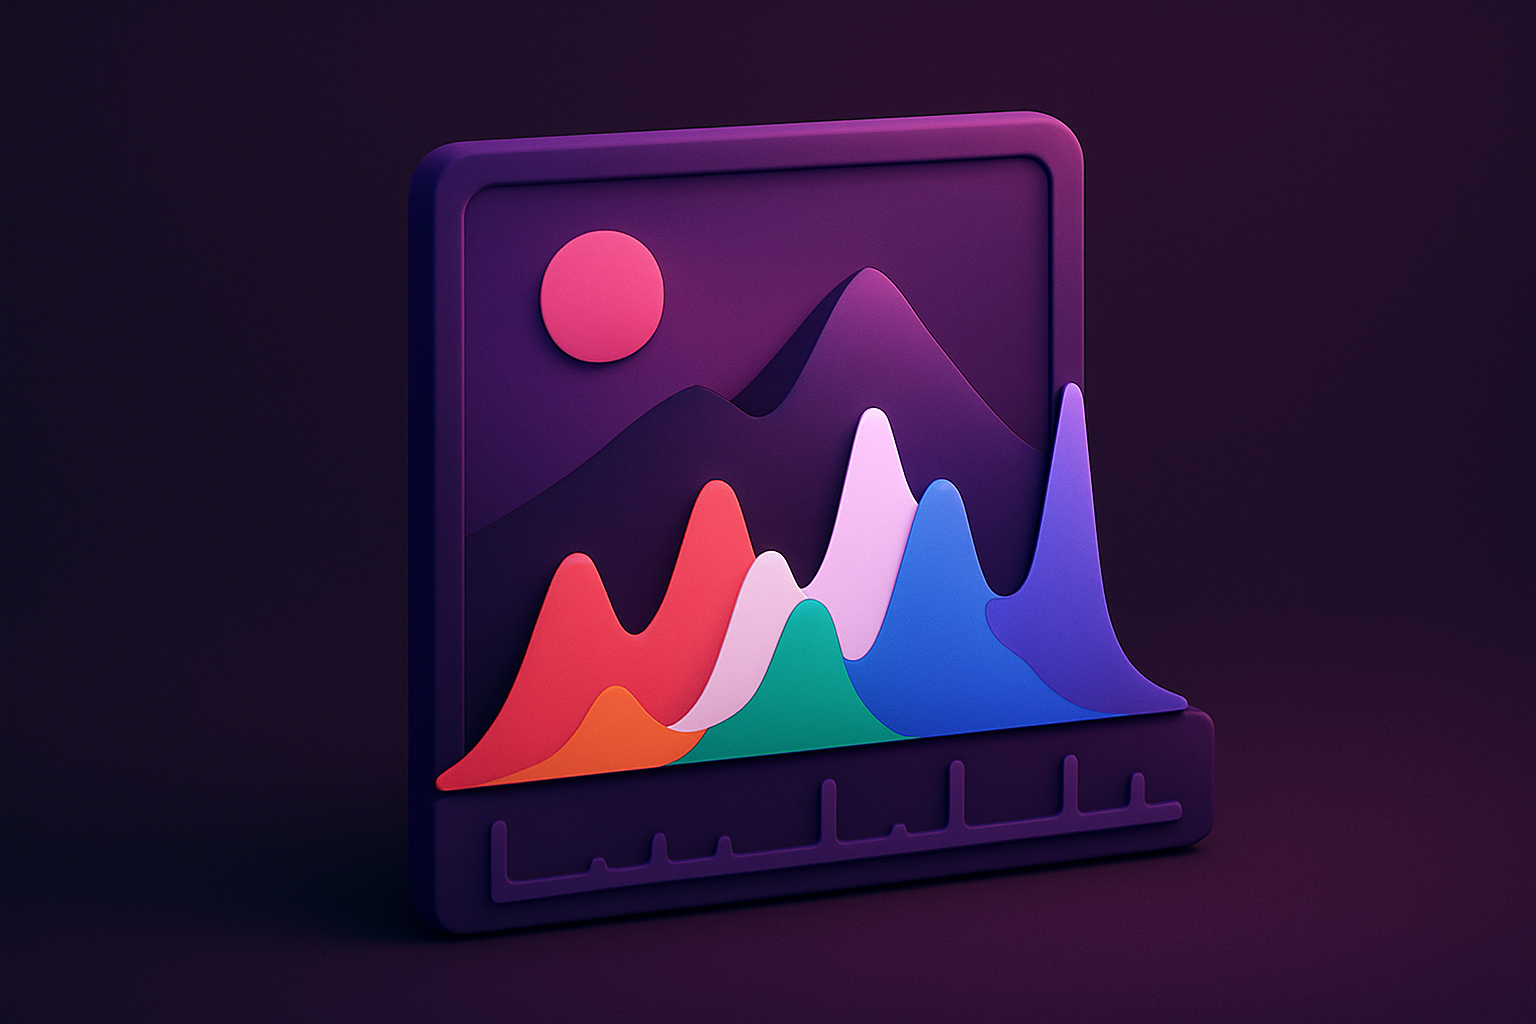
Image Histogram
Visualize the color distribution of an image with RGB and luminance histograms.
Upload Image
Drop or select an image to analyze its color distribution.
View Histograms
See RGB channel and luminance distribution graphs.
Analyze Colors
Examine peaks, shadows, midtones, and highlights.
What Is Image Histogram?
An image histogram tool that visualizes the distribution of pixel values across Red, Green, Blue, and Luminance channels. Histograms are essential for understanding exposure, contrast, and color balance in photographs. The tool displays four separate graphs showing how pixel intensities (0-255) are distributed. Peaks on the left indicate shadows, center peaks show midtones, and right peaks represent highlights.
Why Use Our Image Histogram?
- Separate R, G, B and Luminance channel graphs
- Identify exposure problems and color casts
- Analyze shadow, midtone, and highlight distribution
- Essential for photography and color correction
Common Use Cases
Photography
Check exposure and dynamic range of photos before and after editing.
Color Correction
Identify color casts by comparing RGB channel balance.
Print Preparation
Ensure images have proper tonal range for quality prints.
Image Quality
Detect clipping, underexposure, or overexposure issues.
Technical Guide
Pixel data is extracted via Canvas getImageData. For each pixel, R, G, B values (0-255) are tallied into 256-bin arrays. Luminance is calculated as 0.299R + 0.587G + 0.114B. Histograms are rendered on individual Canvas elements with colored bars scaled to the maximum bin count. X-axis represents intensity (0-255) and Y-axis represents pixel count.
Tips & Best Practices
- 1A well-exposed image has a spread across the full histogram
- 2Clipping at edges means lost detail in shadows or highlights
- 3Compare RGB channels to detect color cast
- 4Use before/after histograms to evaluate edits
Related Tools
Image Color Picker
Click anywhere on an image to pick the exact color value in HEX, RGB, and HSL.
Image Resizer
Resize images by exact pixel dimensions or percentage while maintaining aspect ratio.
Image Crop
Crop images with a visual selection rectangle to remove unwanted areas.
Image Rotate
Rotate images by any angle with preset options for 90, 180, and 270 degrees.
Image Flip Horizontal
Mirror an image horizontally (left to right) with instant processing.
Image Flip Vertical
Flip an image vertically (upside down) with instant processing.
Frequently Asked Questions
QWhat is a histogram?
QWhat do the colors mean?
QHow do I read clipping?
QCan I export the histogram?
QDoes it modify the image?
About Image Histogram
Image Histogram is a free online tool from FreeToolkit.ai. All processing happens directly in your browser — your data never leaves your device. No registration required. No ads. Just fast, reliable tools.